Week 1.2: AC Measurement
1Introduction
In the previous lab you performed measurements on a circuit in which the voltages and currents did not change over time. They were static, and are called ‘DC’. DC stands for Direct Current, but the term is commonly used for constant voltages as well. In the lab you generated DC voltages with a power supply, and measured them with a multimeter.
In this lab you will perform more DC experiments and also perform measurements on AC voltages and currents. The term AC, or Alternating Current, is used for voltages and currents that change over time. The name implies that they may swap polarity, i.e. become negative, sometimes. Such measurements usually require different equipment, namely a function generator to generate AC voltages, and an oscilloscope to measure them.
The power supply, multimeter, function generator and oscilloscope are the most common tools for testing and measuring circuits. You will use them very often so make sure you understand how to use them, and ask questions if something is unclear to you.
Study Goals
After completion of this assignment, you should be able to:
Explain measurements using Ohm’s law, equivalent resistance, and Kirchhoff’s laws,
Explain the influence of non ideal meter impedance.
Use an oscilloscope,
Use a function generator,
Explain the influence of non ideal source resistance and frequency behavior,
Explain the need of a common ground.
2Assignments
2.1Kirchhoff’s laws
Nodes and Branches
A node is a point, or a set of points, connected together by wires, that all have the same voltage. The wires themselves are part of the node, they are not a branch.
A branch is a path between two different nodes, and it must contain something that can support a voltage difference across it, such as a resistor, a source, or another component. A plain wire alone does not create a new branch, since it just merges its two ends into a single node.
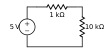
Build the circuit of Figure 1. Next, measure the voltages across each element, write them down.
How to build
While the word “build” may sound official and pretentious, it really isn’t. You can just solder two resistors together “in the air” and connect them to the power supply. Use cables with a banana plug on one end, and a grabber or an alligator/crocodile clip on the other end. See Components. By convention, red cables are used for the + connection, and black cables are used for the − connection.
How do your measurements support the Kirchhoff Voltage Law (KVL)?
Answer
KVL states that the sum of all branch voltages in a loop is zero. You should see that the sum of all your measured voltages equals zero. This assumes a consistent direction: as you travel around the loop, always connect the + probe forward and the − probe backward. This way, each node is touched once by a − probe and once by a + probe.
You will then see that in this circuit, the sign of one voltage is exactly opposite of the other two, with their sum being zero.
If not, is is likely that you have inconsistent measurement direction, which you could correct by reversing the sign of the measured value.
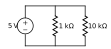
Build the circuit of Figure 2. Next, measure the currents through all branches of the network.
Hint
There are 3 components with a voltage across it, these are the three branches that you should measure. For measuring, you need to cut open the circuit, since measuring current implies that you insert the meter in the current flow.
Which of Kirchhoff law’s should hold for currents in a node? How do your measurement results confirm this law?
Answer
KCL states that the sum of all branch currents entering a node equals the sum of all branch currents leaving it. You should see that the sum of your measured currents equals zero, when you define all currents with a consistent direction. In this circuit, it means the + terminal of the meter is always on the top or always on the bottom.
You will then see that in this circuit, the sign of one current is exactly opposite of the other two with their sum being zero.
If not, is is likely that you have inconsistent measurement direction, which you could correct by reversing the sign of the measured value.
2.2Internal resistance of the multimeter
Voltage meters, including multimeters set to measure voltage, have some unwanted behaviour. These meters have a large internal resistance that is in parallel with the circuit. This resistance can change the voltage reading you see. In this experiment, you will observe that behaviour.
Why does this matter for engineers in general?
Every measurement device becomes part of the system it measures. When you connect a meter, you are not just “looking” at the circuit from the outside. You are adding a new component to it. This component has its own effect, and it will always change something, even if just a little.
This is a key idea in engineering. A good engineer never fully trusts a measurement without asking: how did the measurement change what I was trying to measure? Ignoring this question can lead to wrong conclusions, bad designs, and even systems that fail.
Build the circuit from Figure 3. Use a Farnell TOPS 1 bench power supply as the voltage source. Use the 5 V output and fine-adjust it so that the voltage at point A, when measured with the Fluke 177 digital multimeter, is exactly 5.0 V.
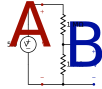
Figure 3:Circuit for observing effect of multimeter input resistance.
Predict the voltage at node B using the voltage divider formula.
Now, measure in the built circuit. You will find a value that differs from you answer at Step 2. Also note that the measurement error of the Fluke multimeter is specified to be less than 0.1 % + 2 digits and that this can not explain the difference. Explain how a large resistance inside the meter in parallel with its input pins can cause this deviation.
Explanation
The voltage divider formula gives 2.5 V for . Your measurement should be around 2.4 V. Now, assume that there is a resistor of 10 MΩ, inside the multimeter in parallel with its input pins. Effectively, this is in parallel to the 1 MΩ resistor and the effective resistance from node to ground will be 900 kΩ and the voltage division would result in 2.38 V.
Calculate the internal resistance of the multimeter based on your measurement from the previous question. Optionally, look up the datasheet of the multimeter online and check if you can find the specified input resistance.
Answer
You can calculate the multimeter’s input resistance. Call this unknown value .
Compute the parallel resistance of 1 MΩ and . This equals MΩ (check this yourself).
Write down the voltage divider equation, using as the unknown.
Fill in the voltage value you measured.
Solve the equation for .
The input resistance of the Fluke 177 multimeter in DC voltage mode is at least 10 MΩ.
Why do voltmeters have a smaller than infinite parallel input resistance?
A practical voltmeter needs some current to operate (energy must come from somewhere), so its resistance can never be infinite. It is designed to be as high as possible, so it draws very little current and barely disturbs the circuit being measured. However, this disturbance increases when the circuit’s own resistances get closer in value to the voltmeter’s resistance.
And current meters?
Current meters work in the opposite way. They have a small series resistance. The meter measures the voltage across this small resistor. From this voltage, it calculates the current.
The resistor must be small. If it were large, it would add too much resistance to the circuit. This would change the current flowing through it, which would cause measurement errors.
2.3Internal resistance of the function generator
Voltage sources in reality are never ideal but always have some internal resistance. A simple model of this can be seen in Figure 4. Power supplies have a very low internal resistance, while function generators often have an internal resistance of 50 Ω. Often, they are also loaded by an external resistance of 50 Ω.

Figure 4:Model for a real voltage source that includes the internal resistance. The voltage source that is part of the model is ideal.
Why 50 Ω?
This value comes from the properties of certain types of cables at very high frequency. In some way, at these frequencies, the cables behave like 50 Ω resistors. Also, the signals start to show wave-like behaviour, and travel time along the cable is no longer negligible. In such cases, the system works best when all resistances and impedances are matched (equal). Hence, 50 Ω is a common standard for measurement equipment. You will learn more about this later in your study.
What happens to the voltage that you measure at the output of a function generator, with an internal resistance of about 50 Ω, when it is connected to a load resistance that is not very much larger than the source resistance?
Hint
Think of voltage division
Given the internal voltage in Figure 4, What is the maximum current this voltage source can deliver?
Hint
Use Ohm’s law with symbolic values like and . Then, interpret your result by filling in numbers, e.g. 5 V and 50 Ω.
Find a method to experimentally determine the internal resistance of the function generator. It is not allowed/possible to use the multimeter in the ‘Ohm’ domain. Write down your method and illustrate it with schematics and equations. Note: The function generator display does not always show the correct output voltage.
Before you continue
Discuss your method with a TA before you continue.
Perform your proposed method and then obtain the value of the internal resistance of the function generator.
Answer
If you don’t find a value close to 50 Ω, something is wrong. Try to understand what went wrong, and correct your work. You may want to consult Problem Solving in Engineering
2.4AC Measurements
In this assignment, you will work with an oscilloscope and again the function generator. You will find out how they interact.
Getting started
Turn the function generator on, and configure it such that it outputs a sinusoidal signal with an amplitude of 2 Vpp and a frequency of 100 kHz.
Grab a coaxial cable with a female BNC connector on both ends. Connect the output of the function generator with the channel 1 (CH1) input of the oscilloscope. Press the
ONbutton above the output to activate the function generator.Turn the oscilloscope on. Configure it as follows:
Set the vertical scale of CH1, shown in the bottom-left corner of the display, to 1 V/div.
Set the time scale such that 3 periods of the signal are visible.
Press the yellow
1button to show the settings of CH1 on the right of the display.Make sure the
Probe Voltagesetting is set to1x.Make sure the
Couplingsetting is set toDC.
The oscilloscope uses the signal’s intersections with an invisible horizontal line to decide the horizontal position of the signal on the display. This invisible horizontal line is called the trigger level. To change the trigger level, turn the
Levelknob in theTriggermenu, and observe its effect on the display. Make sure to set the trigger level back to 0 after playing around!
The effect of internal resistance
Compare the amplitude of the signal on the display of the function generator with the one on the display of the oscilloscope. What is the amplitude ratio?
Answer
You should see that the amplitude on the oscilloscope is twice that on the function generator. But why does this happen?
The function generator assumes a 50 Ω load by default. Because the internal resistance of its output is also 50 Ω, it doubles the signal amplitude (and offset) such that the voltage at the output port matches what it says on the display. This scenario is shown in Figure 6.
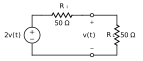
Figure 6:The function generator assumes a 50 Ω load by default, and generates double the intended output voltage to compensate for the effect of its internal resistance.
The problem is that in our case the load, i.e. the input of the oscilloscope, is not 50 Ω but 1 MΩ! Hence, the voltage drop across the source resistance of the function generator is negligible, and double the voltage ends up across the oscilloscope input.
The amplitude ratio can be fixed by telling the function generator that it should assume that the load is much larger than 50 Ω. The function generator will then stop doubling the amplitude and offset of the output signal. Consequently the displayed value matches what the oscilloscope observes at the output of the function generator.
On the function generator, press the
Top Menubutton and go toOutput Menu>Load Impedanceand set it toHigh Z. The concept of impedance will be treated in future lectures. For now, it is safe to assume that for these experiments, impedance (Z) is just another term for resistance (R). Therefore,High Zis equivalent to saying that the function generator should assume a high R, i.e. high load resistance.Verify that the amplitude values on the function generator display match what you see on the oscilloscope display.
If not?
The amplitudes should really read the same value. Try and find out what might be wrong, and ask a TA if needed.
Readjust the function generator such that the output amplitude is 2 Vpp.
The effect of attenuation
Make a photo of the oscilloscope display. You will need this in a later exercise.
Put the coaxial cable back on the cable rack. Find a BNC-to-grabber cable, i.e. coaxial cable with BNC connector on one end and two grabber connectors on the other end, and attach it to the function generator. Find a voltage probe, and attach it to the oscilloscope.
Use the probe to measure the voltage across the two grabbers. Make sure that the probe’s ground pin, which has a crocodile connector, is connected to the black grabber. This prevents ground loops.
Compare the oscilloscope display with your photo. Explain the differences.
Press the yellow
1button, and setProbe Voltageto10x. Now the oscilloscope assumes that the signal at CH1 comes from a probe that attenuates the measured voltage by 10x. To compensate, the oscilloscope amplifies CH1 by 10x. Compare the display with your photo. They should look identical.Most probes in the Tellegen Hall attenuate signals by a factor of 10x. This is specified on the probe itself, usually on a label. Inspect your probe and see where it says the attenuation factor.
The effect of coupling
Add a 1.5 V DC offset to the signal using the function generator.
On the oscilloscope, adjust vertical scale of CH1 such that the signal fits on the display. Increase the trigger level such that it intersects with the signal. The oscilloscope uses the intersections to align the signal horizontally.
Press the yellow
1, and setCouplingfromDCtoAC. Explain what changed on the display.
Other functions
Move the trigger level so far up that the oscilloscope is unable to find intersections with the signal on CH1. Now press
AUTOSET. Observe what happens.Feel free to play around with the buttons on the function generator and see what the output looks like on the oscilloscope. You will use this equipment many times in future courses, so it does not hurt to become intimately familiar with them.
Ask a TA to sign off your work.